New South Wales experienced record high temperatures, well below average rainfall, heatwaves, strong westerly winds and low humidity during spring–summer 2019–20. The extreme weather conditions, combined with prolonged intense drought, brought dangerous bushfire conditions across the eastern half of the State and record levels of dust-storm activity Statewide.
Bushfires began in the north-east as early as winter 2019 and spread south through eastern New South Wales. The extent of the burnt area in the NSW bushfire season 2019–20 was 5.5 million hectares, nearing the total area burnt in the combined bushfire seasons from 1993–94 to 2018–19. Extensive bushfire smoke and dust storms led to extreme levels of air pollution during spring–summer 2019–20.
The NSW Department of Climate Change, Energy, the Environment and Water implemented an emergency response in collaboration with public health and fire and land management authorities. Our integrated air quality monitoring, forecasting and reporting systems provided hourly updated information on air pollution levels and health risks to support decision making on emergency management responses by relevant authorities. The interagency collaboration enhanced the delivery of consistent messaging on the status of air quality and measures to minimise exposure for individuals and service providers in smoke-affected communities.
Our key actions
Our key actions are summarised below:
- The department operated the most extensive air quality monitoring network in Australia, with more than 90 stations across urban, regional and rural NSW, providing the community with accurate, up-to-date air quality information on an hourly basis.
- We deployed 9 bushfire emergency air quality monitoring stations, providing near real-time air quality information to communities near fire fields in regions extending from the NSW Northern Rivers to the South Coast and Snowy Mountains.
- We enhanced our air quality modelling and forecasting capability with improved emissions modelling systems to better predict the dynamic behaviour of smoke and dust plumes and improve early warnings.
- We issued air quality forecasts and health advice in consultation with emergency response agencies to facilitate public health management. We conducted multiple forecast reviews each day and issued health alert messages when air quality was forecast to exceed air quality standards.
- We upgraded our website in response to community requests for improved reporting of near-real time changes in air quality, publishing hourly-averaged particle measurements and enhanced health guidance and advice.
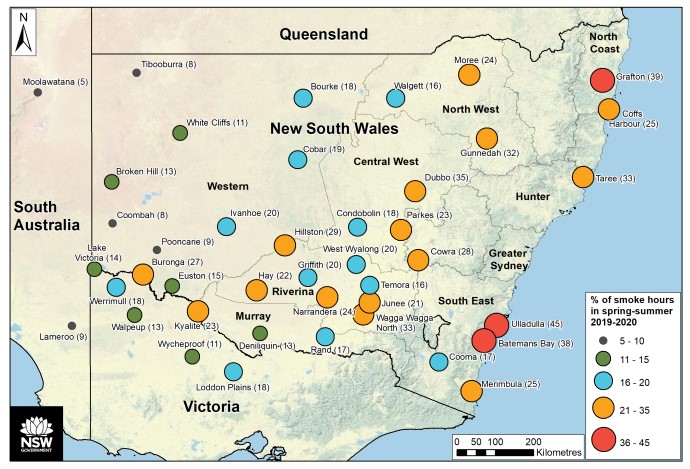
NSW rural and regional air quality in spring-summer 2019–20 shown as the percentage of hours with air quality affected by smoke at stations in the NSW Rural Air Quality Monitoring Network and bushfire emergency air quality monitoring stations at Grafton, Coffs Harbour, Taree, Ulladulla, Batemans Bay, Merimbula and Cooma. The percentage of hours affected by smoke ranged from 8% in Western New South Wales to 45% at Ulladulla in South-Eastern New South Wales.

NSW air quality in spring-summer 2019–20, shown as the percentage of days above and below air quality reporting standards, across regions in the standard monitoring network. The percentage of days above standards ranged from 22% in the Central Coast region to 47% in the Newcastle local region. The Stockton monitoring station in Newcastle is located approximately 300m from the ocean and typically records more days above the PM10 benchmark than other stations, due to the impact of sea salt.
Extreme air pollution levels
All regions across the NSW Air Quality Monitoring Network recorded extended periods of poor air quality due to smoke and dust, during spring–summer 2019–20. The extreme air pollution levels are summarised below, in comparison with air quality benchmarks and long-term records:
- Air pollution levels were above benchmarks for poor air quality on 134 days (74% of spring–summer days) across the standard monitoring network, compared to 83 days (46%) in spring–summer 2018–19. The percentage of days above benchmarks across regions in the Network in spring-summer 2019–20 ranged from 22% in the Central Coast to 47% in the Newcastle Local region.
- The percentage of hours affected by smoke across our rural and bushfire indicative air quality monitoring stations ranged from 8% in western NSW to 45% at Ulladulla in south-eastern NSW.
- Daily PM2.5 levels were above the benchmark across the standard monitoring network on 99 days (54% of spring–summer days), mainly due to bushfire smoke, compared to 4 days in spring–summer 2018–19. Bushfire emergency monitoring stations recorded 46 days above the benchmark, including 10 days not recorded by the standard monitoring network.
- Daily PM10 levels were above the benchmark across the standard monitoring network on 140 days (77% of spring–summer days), due to dust and bushfire smoke, compared to 78 days in spring–summer 2018–19. Bushfire emergency monitoring stations recorded 43 days above the benchmark, including four days not recorded by the standard monitoring network.
- Hourly NEPH (visibility) levels were above the benchmark across the standard monitoring network on 115 days (63% of spring–summer days), mainly due to bushfire smoke, compared to 13 days in spring-summer 2018-19. Bushfire emergency monitoring stations recorded 66 days above the benchmark, including 15 days not recorded by the standard monitoring network.
- Ozone levels were above either the one-hour or four-hour average benchmarks on 32 days (18% of spring–summer days), compared to 13 days in spring–summer 2018–19. Bushfire emergency monitoring stations recorded two days above the benchmark.
- The hourly NO2 level was above the benchmark on one day within the standard monitoring network. This event was the first day over the benchmark since 1998.
- The 8-hour CO level was above the benchmark on two days at a bushfire emergency monitoring station, the first event over the benchmark since 2013.
Air quality extremes – new records at a glance
Air quality records refer to the period 1994 to 29 February 2020 – from the expansion of NSW Air Quality Monitoring Network in 1994 to end of summer 2019–20:
- The highest daily PM2.5 level since 1994 (560 µg/m3, 22 times the benchmark) was recorded at Wagga Wagga North in the South-west Slopes on 5 January 2020, mainly due to bushfire smoke. Before spring–summer 2019–20, the record was 416 µg/m3 at Wallsend on 23 September 2009 (during the Red Dawn dust event).
- The fourth highest daily PM10 level since 1994 (621 µg/m3, 12 times the benchmark), and the highest since 2009, was recorded at Merriwa in the Upper Hunter region on 11 January 2020 during a widespread dust storm.
- The highest hourly nephelometer reading since 1994 for reduced visibility due to particle pollution (105.1, 50 times the benchmark) was recorded at Goulburn on 31 December 2019 due to bushfire smoke. Before spring–summer 2019–20, the highest nephelometer reading was 86.2, recorded at Bargo in Sydney South-west during the NSW bushfire emergency in spring 2013.
- The highest one-hour average NO2 level since 1994 (16.1 pphm), and the first day above the benchmark since 1998, was recorded at Goulburn in the Southern Tablelands on 31 December 2019. Before spring–summer 2019–20, the previous record was 13.3 pphm at Bringelly in Sydney South-west on 15 January 1996.
- The highest 8-hour rolling average CO level since 1994 (9.6 ppm) was recorded at the Port Macquarie bushfire emergency monitoring station on 15 November 2019. Before spring–summer 2019–20, the previous record was 9.1 ppm at Campbelltown West in Sydney South-west on 21 October 2013.
- The third highest one-hour average ozone level since 1994 (17.9 pphm), and the highest since 2001, was recorded at Rozelle and Earlwood in Sydney East in December 2019.
- The third highest 4-hour average ozone level since 1994 (14.9 pphm), and the highest since 2003, was recorded at Rozelle in Sydney East on 19 December 2019.
Continuous improvement
Our emergency response experience led to improvements in our data delivery services, air quality monitoring, modelling and forecasting. Ongoing projects provide continuous improvement in our science capability and services:
- Our major program, Enhanced website and data delivery, commissioned in 2019, is ensuring an advanced system meets the increasing demand from businesses and the community for reliable air quality information, delivering air quality and meteorology data to a range of viewing platforms.
- Our major program, Enhancing air quality forecasting in NSW, is continually improving our competence in forecasting the dynamic behaviour of smoke and dust plumes.
- We are working with national and other jurisdictions and the National Air Technical Advisory Group to ensure a nationally consistent approach to reporting air quality and associated health advice.
- Our emergency response experience has led to technical innovations and strengthened interagency communication protocols that build our capacity to contribute to a better future for NSW communities.
Defining the network
The Air Quality Statement reports data recorded across the NSW Air Quality Monitoring Network from stations using various methods and monitoring equipment. A set of stations record data for reporting compliance with national standards set by the National Environment Protection (Ambient Air Quality) Measure. Industry-funded and bushfire air quality monitoring stations are intentionally located near air pollution sources and data are not intended for compliance reporting. The Statement compares data from these stations to air quality standards for public interest. Therefore, the Statement refers to air quality standards as ‘benchmarks’. Data from bushfire air quality monitoring stations using indicative monitoring methods are not compared with air quality standards in this report.
Some terms in the statement are defined below:
- ‘Standard monitoring network’ refers to long-term, industry funded and research stations using compliance methods.
- ‘Bushfire monitoring station’ refers to emergency monitoring stations deployed during the NSW bushfire season 2019–20, equipped with standard or indicative monitoring instruments.
- ‘Indicative air quality monitoring station’ refers to stations with indicative monitors, those from the NSW Rural Air Quality Monitoring Network and those deployed in the NSW bushfire season 2019–20.
More details
Detailed information on air quality levels, climate and the department’s response during the spring–summer 2019–20 bushfire season, can be found at: