Cathie Creek is situated on the mid-north coast of New South Wales, just south of Port Macquarie. This estuary is classed as a lagoon.
The estuary has an intermittently closed entrance which connects Lake Cathie with the sea.
In 1933, a channel was dug between Lake Innes to the north and Cathie Creek. This greatly expanded the size of the estuary. Debate continues to this day around this issue of turning a freshwater lake into an estuarine system and future management plans.
Water quality report card
As part of our water quality monitoring program we assess the water quality and ecosystem health of an estuary using a range of relevant indicators. We sample 2 sites on a monthly basis over summer in Cathie Creek every 3 years. The most recent sampling was completed over the 2015–16 summer.
This report card represents 2 water quality indicators that we routinely measure: the amount of algae present and water clarity. Low levels of these 2 indicators equate with good water quality.
Algae
Water clarity
Overall grade
The report card shows the condition of the estuary was excellent with:
- algae abundance graded good (A)
- water clarity graded excellent (B)
- overall estuary health graded excellent (A).
Grades for algae, water clarity and overall are represented as:
- A – excellent
- B – good
- C – fair
- D – poor
- E – very poor.
Go to estuary report cards to find out what each grade means, read our sampling, data analysis and reporting protocols, and find out how we calculate these grades.
| Year | Algae | Water clarity | Overall grade |
|---|---|---|---|
| 2012–13 | B | B | B |
Physical characteristics
| Estuary type | Lagoon |
|---|---|
| Latitude | –31.55 (ºS) |
| Longitude | 152.86 (ºE) |
| Catchment area | 105.5 km2 |
| Estuary area | 13.7 km2 |
| Estuary volume | 8379.5 ML |
| Average depth | 1.1 m |
Tidal exchange volume
Tidal exchange volume or tidal prism data is available for this estuary. This tidal prism was measured in 1982.
| Tide state | Flow (ML) | Local tidal range (m) | Sydney Harbour tidal range (m) |
|---|---|---|---|
| Ebb flow | 220 | 0.27 | 1.34 |
| Flood flow | 350 | 0.31 | 1.32 |
Notes: km2 = square kilometres; m = metres; m3 = cubic metres; ML = megalitres.
Water depth and survey data
Bathymetric and coastal topography data for this estuary are available in our data portal.
Land use
The catchment of Cathie Creek is moderately disturbed, being situated on the southern fringe of Port Macquarie. Urban development accounts for about 15% of total land use, though substantial areas of bushland remain intact and protected within the catchment. Over two-thirds of total land use is undisturbed forest.
National and marine parks
- Lake Innes Nature Reserve is the largest conservation area in this catchment.
- This estuary does not flow into a marine park.
Community involvement
- The Lake Cathie Landcare Group host weekly working bees for volunteers around Lake Cathie that aim to control weeds and revegetate native trees, shrubs and grasses.
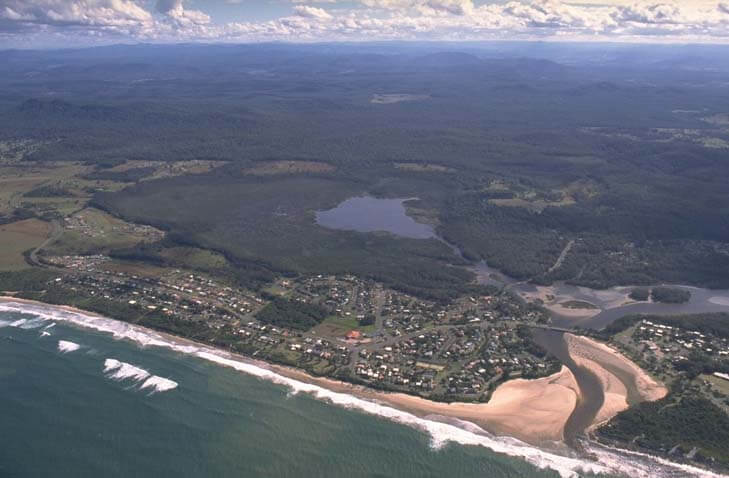
Aerial view of Cathie Creek
Local government management
Local councils manage estuaries within their area unless the estuary is attached to a marine park.
Cathie Creek is managed by Port Macquarie Hastings Council. More information, including the Lake Cathie Coastal Zone Management Plan, plan can be found on the council’s Lake Cathie webpage.
Threatened species
Endangered coastal saltmarsh occurs around the estuary of Cathie Creek and provides important habitat for wading birds.
Read more about the biodiversity in our estuaries.