The NSW Government maintains 20 air quality monitoring stations in the Hunter Valley. This includes:
- 3 government-funded stations in the Lower Hunter
- 3 industry-funded stations around the Port of Newcastle (Newcastle local network)
- one mixed industry and government-funded background station at Merriwa in the Upper Hunter
- 13 industry-funded stations in the Upper Hunter.
The government-operated, industry-funded Upper Hunter and Newcastle local air quality monitoring networks were established in 2011 and 2014 to monitor ambient air quality in these regions that may be affected by local industrial and other pollution sources.
Due to the proximity of industrial sources, the national ambient air quality standards do not apply directly to the data collected at these monitoring stations. The exceptions are the Upper Hunter large population centre stations at Muswellbrook, Singleton and Aberdeen, which have been reported for compliance purposes since 2020.
However, the government recognises the community's interest in knowing how air pollution levels at these stations compare against the standards. Therefore, this section refers to national standards as national benchmarks when evaluating air quality data throughout the Hunter Valley.
More information on these networks can be found on our website, including seasonal newsletters and air quality monitoring reports.
Hunter large population centres
- Upper Hunter – Aberdeen, Singleton and Muswellbrook
- Lower Hunter – Beresfield, Newcastle and Wallsend
- Newcastle Local – Carrington, Mayfield and Stockton
Gaseous pollutants
Ozone (O3), sulfur dioxide (SO2) and nitrogen dioxide (NO2) remained within the relevant national benchmarks in the Upper Hunter, Lower Hunter and Newcastle local networks during 2022. In 2021, there was one day with a 1-hour SO2 level above the standard, recorded at Muswellbrook in the Upper Hunter.
The highest 1-hour SO2 level in the Hunter population centres in 2022 was 10.0 pphm, recorded at Muswellbrook station in the Upper Hunter on 17 March 2022. Measurements of SO2 were only available at Muswellbrook from late February onwards in 2022, due to an instrument fault. This is important to note as based on historical data, SO2 levels at Muswellbrook are usually higher during summer and can exceed the standard levels.
Note that the measured level of SO2 must be at least 0.1 pphm higher than the national standard for it to be considered an exceedance.
PM10 particles
Within the Hunter population centres, PM10 levels generally are highest at Stockton in the Newcastle local region, due to the influence of sea salt under onshore winds (Lower Hunter Particle Characterisation Study). Refer to the Stockton page for more information.
In the Upper Hunter region, PM10 levels generally are highest at stations closest to mining activity.
Annual averages
In 2022, annual average PM10 levels exceeded the 25 µg/m3 benchmark only at Stockton (1 of 9 larger population centres) with a level of 30.3 µg/m3. Excluding Stockton, annual averages ranged from 12.3 µg/m3 at Aberdeen to 19.3 µg/m3 at Carrington.
Daily averages
Daily average PM10 levels exceeded the benchmark on one day in Hunter population centres, excluding Stockton. This occurred on 27 January 2022 at Mayfield in Newcastle, due to an unidentified source. Hourly PM10 levels were elevated morning and afternoon, under moderate easterly winds.
At Stockton, the daily PM10 average was over the benchmark on 37 days, with the predominant cause on each of those days determined to be sea salt under onshore air flows. Refer to the Stockton page for more information.
The maximum daily PM10 average recorded in the Hunter population centres occurred at Stockton on 17 January 2022 with a level of 95.9 µg/m3. Excluding Stockton, the maximum daily PM10 level in the Hunter population centres occurred at Mayfield with a level of 72.0 µg/m3 on 27 January 2022.
PM2.5 particles
Annual averages
Annual average PM2.5 levels in 2022 remained within the 8 µg/m3 benchmark at all 8 stations measuring PM2.5 in the Hunter's large population centres, noting that PM2.5 is not currently recorded at Aberdeen. Annual averages ranged from 5.0 µg/m3 at Beresfield to 7.5 µg/m3 at Stockton.
Daily averages
There were no daily average PM2.5 levels recorded over the benchmark at any of the Hunter population centres in 2022, which is similar to 2021.
The maximum daily average PM2.5 level was 23.7 µg/m3, recorded at Stockton on 18 January 2022, and was predominantly caused by sea salt under onshore air flows. The second highest day occurred at Carrington on 21 February 2022 with a level of 19.9 µg/m3, and was likely due to smoke from bushfire activity at Port Stephens.
Upper Hunter
The Upper Hunter air quality monitoring network comprises 14 stations. There are 3 stations in larger population centres, 6 stations in smaller communities, 3 diagnostic stations close to mining operations and 2 background stations at the north-west and south-east extents of the region.
Annual averages
All monitoring stations in the Upper Hunter recorded annual average PM10 levels within the 25 µg/m3 benchmark in 2022 (see Upper Hunter PM10 summary graph). PM10 annual averages in the Upper Hunter ranged from 10.6 µg/m3 at Bulga to 19.3 µg/m3 at Warkworth.
For 12 of 14 stations, the annual PM10 average recorded in 2022 was the lowest since the network was established in 2012. The exceptions were Warkworth, which has experienced an increase in nearby mining activities, and Jerrys Plains. Warkworth PM10 annual averages were the lowest since 2017, while Jerrys Plains were the lowest since 2013.
All 4 stations monitoring PM2.5 in the Upper Hunter (Muswellbrook, Singleton, Camberwell and Merriwa) recorded annual average PM2.5 levels within the 8 µg/m3 benchmark in 2022. PM2.5 annual averages ranged from 3.4 µg/m3 at Merriwa to 6.2 µg/m3 at Muswellbrook.
This is the second year in a row that Muswellbrook has experienced an annual average PM2.5 level within the current standard of 8 µg/m3. The station recorded levels above the annual standard each year between 2011 to 2020, predominantly driven by woodsmoke in cooler months and bushfire smoke.
Daily averages
There were 2 days with daily average PM10 levels recorded over the benchmark in the Upper Hunter in 2022, compared to 6 days in 2021. These occurred at Warkworth on 20 November 2022 and Muswellbrook North West on 12 December 2022.
Days over the PM10 benchmark
| Date | Number of stations over benchmark |
|---|---|
| 20/11/2022 | 1 |
| 12/12/2022 | 1 |
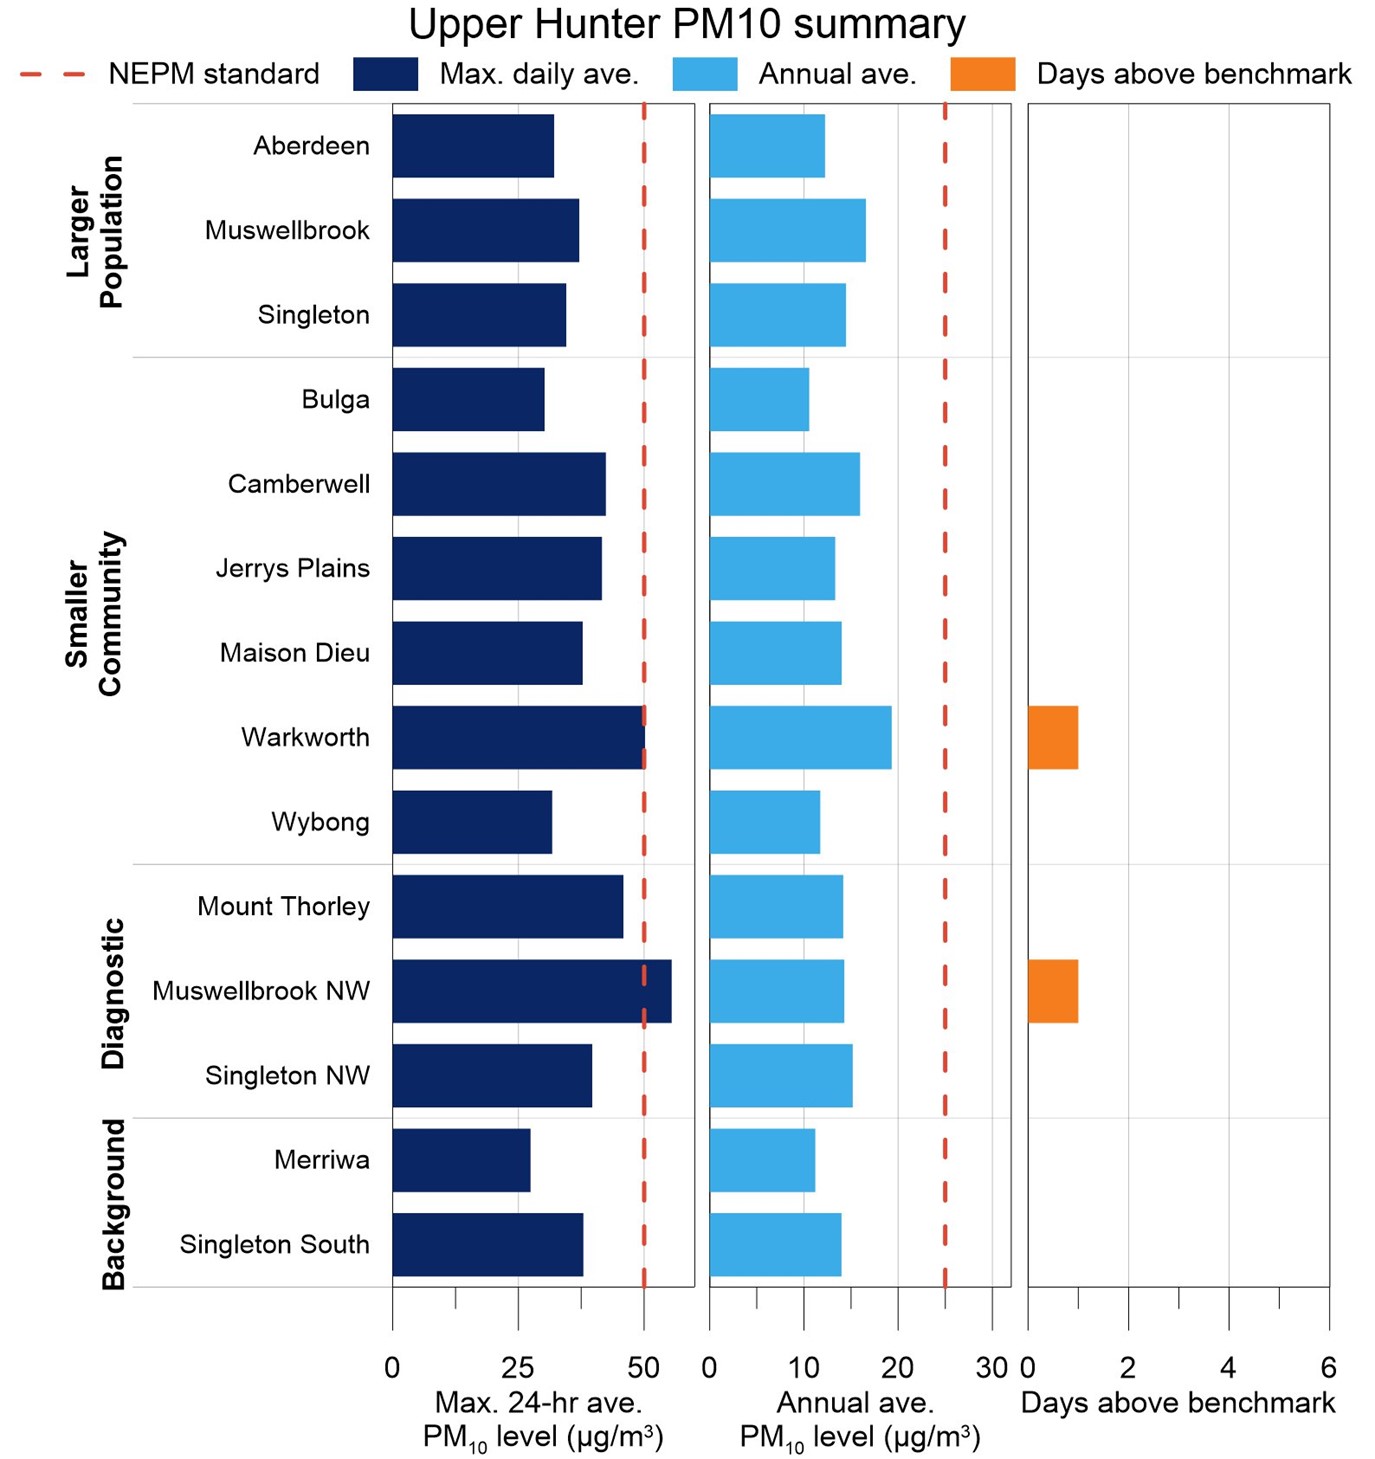
Upper Hunter PM10 summary Bar chart showing the maximum daily average, annual average and exceptional and non-exceptional event days for PM10 for each of the 14 stations in the Upper Hunter.
Bar chart showing the maximum daily average, annual average and days above the PM10 benchmark for each of the 14 stations in the Upper Hunter.
Note: Exceedance days have not been divided into exceptional and non-exceptional events, as the National Environment Protection (Ambient Air Quality) Measure compliance goals are not applied to smaller community, diagnostic or background stations.