Broken Head Creek is a lagoon with a predominantly closed entrance, located between Suffolk Park and Broken Head on the north coast of New South Wales. It is a small lagoon and most regarded for its tannin-stained waters.
Broken Head Creek is secluded in a small catchment made up mostly of bushland, part of which is protected under the Ti-Tree Lake Aboriginal Area, which backs onto Suffolk Park.
Water quality report card
As part of our water quality monitoring program we assess the water quality and ecosystem health of an estuary using a range of relevant indicators. We sample a subset of the estuaries located between the Queensland border and Taree every 3 years. The most recent sampling in Broken Head Creek was completed over the 2021–22 summer, when 2 sites were sampled on a monthly basis.
This report card represents 2 water quality indicators that we routinely measure: the amount of algae present and water clarity. Low levels of these 2 indicators equate with good water quality.
Algae
Water clarity
Overall grade
The report card shows the condition of the estuary was fair with:
- algae abundance graded poor (D)
- water clarity graded good (B)
- overall estuary health graded fair (C).
Grades for algae, water clarity and overall are represented as:
- A – excellent
- B – good
- C – fair
- D – poor
- E – very poor.
Go to estuary report cards to find out what each grade means, read our sampling, data analysis and reporting protocols, and find out how we calculate these grades.
We have monitored water quality in the Broken Head Creek since 2007. This table shows the water quality grades for this estuary over that time.
| Year | Algae | Water clarity | Overall grade |
|---|---|---|---|
| 2015–16 | D | A | B |
Physical characteristics
| Estuary type | Lagoon |
|---|---|
| Latitude | –28.7 (ºS) |
| Longitude | 153.61 (ºE) |
| Catchment area | 1.1 km2 |
| Estuary area | 0.1 km2 |
| Estuary volume | 15.3 ML |
| Average depth | 0.3 m |
Notes: km2 = square kilometres; m = metres; ML = megalitres.
Water depth and survey data
Bathymetric and coastal topography data for this estuary are available in our data portal.
Land use
Broken Head Creek receives water from a moderately disturbed catchment. Perched up in the catchment is an old quarry and urban development fringes the largely forested catchment.
National and marine parks
- Ti-Tree Lake Aboriginal Area is located within the catchment of Broken Head Creek.
- the estuary is also part of Cape Byron Marine Park.
Citizen science projects
- Byron Bird Buddies is a volunteer community group involved with bird monitoring, conservation and education in the Northern Rivers region.
Community involvement
- The declaration of the Ti Tree Lake Aboriginal Area in 2000 and the signing of the Ti Tree Lake Aboriginal Area Indigenous Land Use Agreement in 2006 recognise the significance of the lagoon and its heritage values to the local Arakwal community.
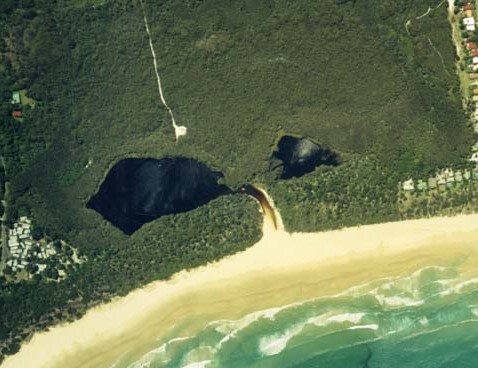
Aerial view of Broken Head Creek estuary.
Local government management
Local councils manage estuaries within their area unless the estuary is attached to a marine park.
Broken Head Creek estuary is managed by Byron Bay Council. The estuary is also part of the Cape Byron Marine Park.
Threatened species
The catchment area for this estuary forms part of the regional coastal wildlife corridor, which supports the movement of threatened species such as the long-nosed potoroo.
Read more about the biodiversity in our estuaries.