Tracking dust in New South Wales
Dust storms are natural and at times continental-scale events where wind moves soil from one place to another. They can cause enormous economic and environmental damage and lead to very poor air quality. The main drivers of dust storms are strong winds above 40 km/hr, poor vegetation cover below 50%, and soil characteristics such as loose soil type, small particle size and low soil moisture.
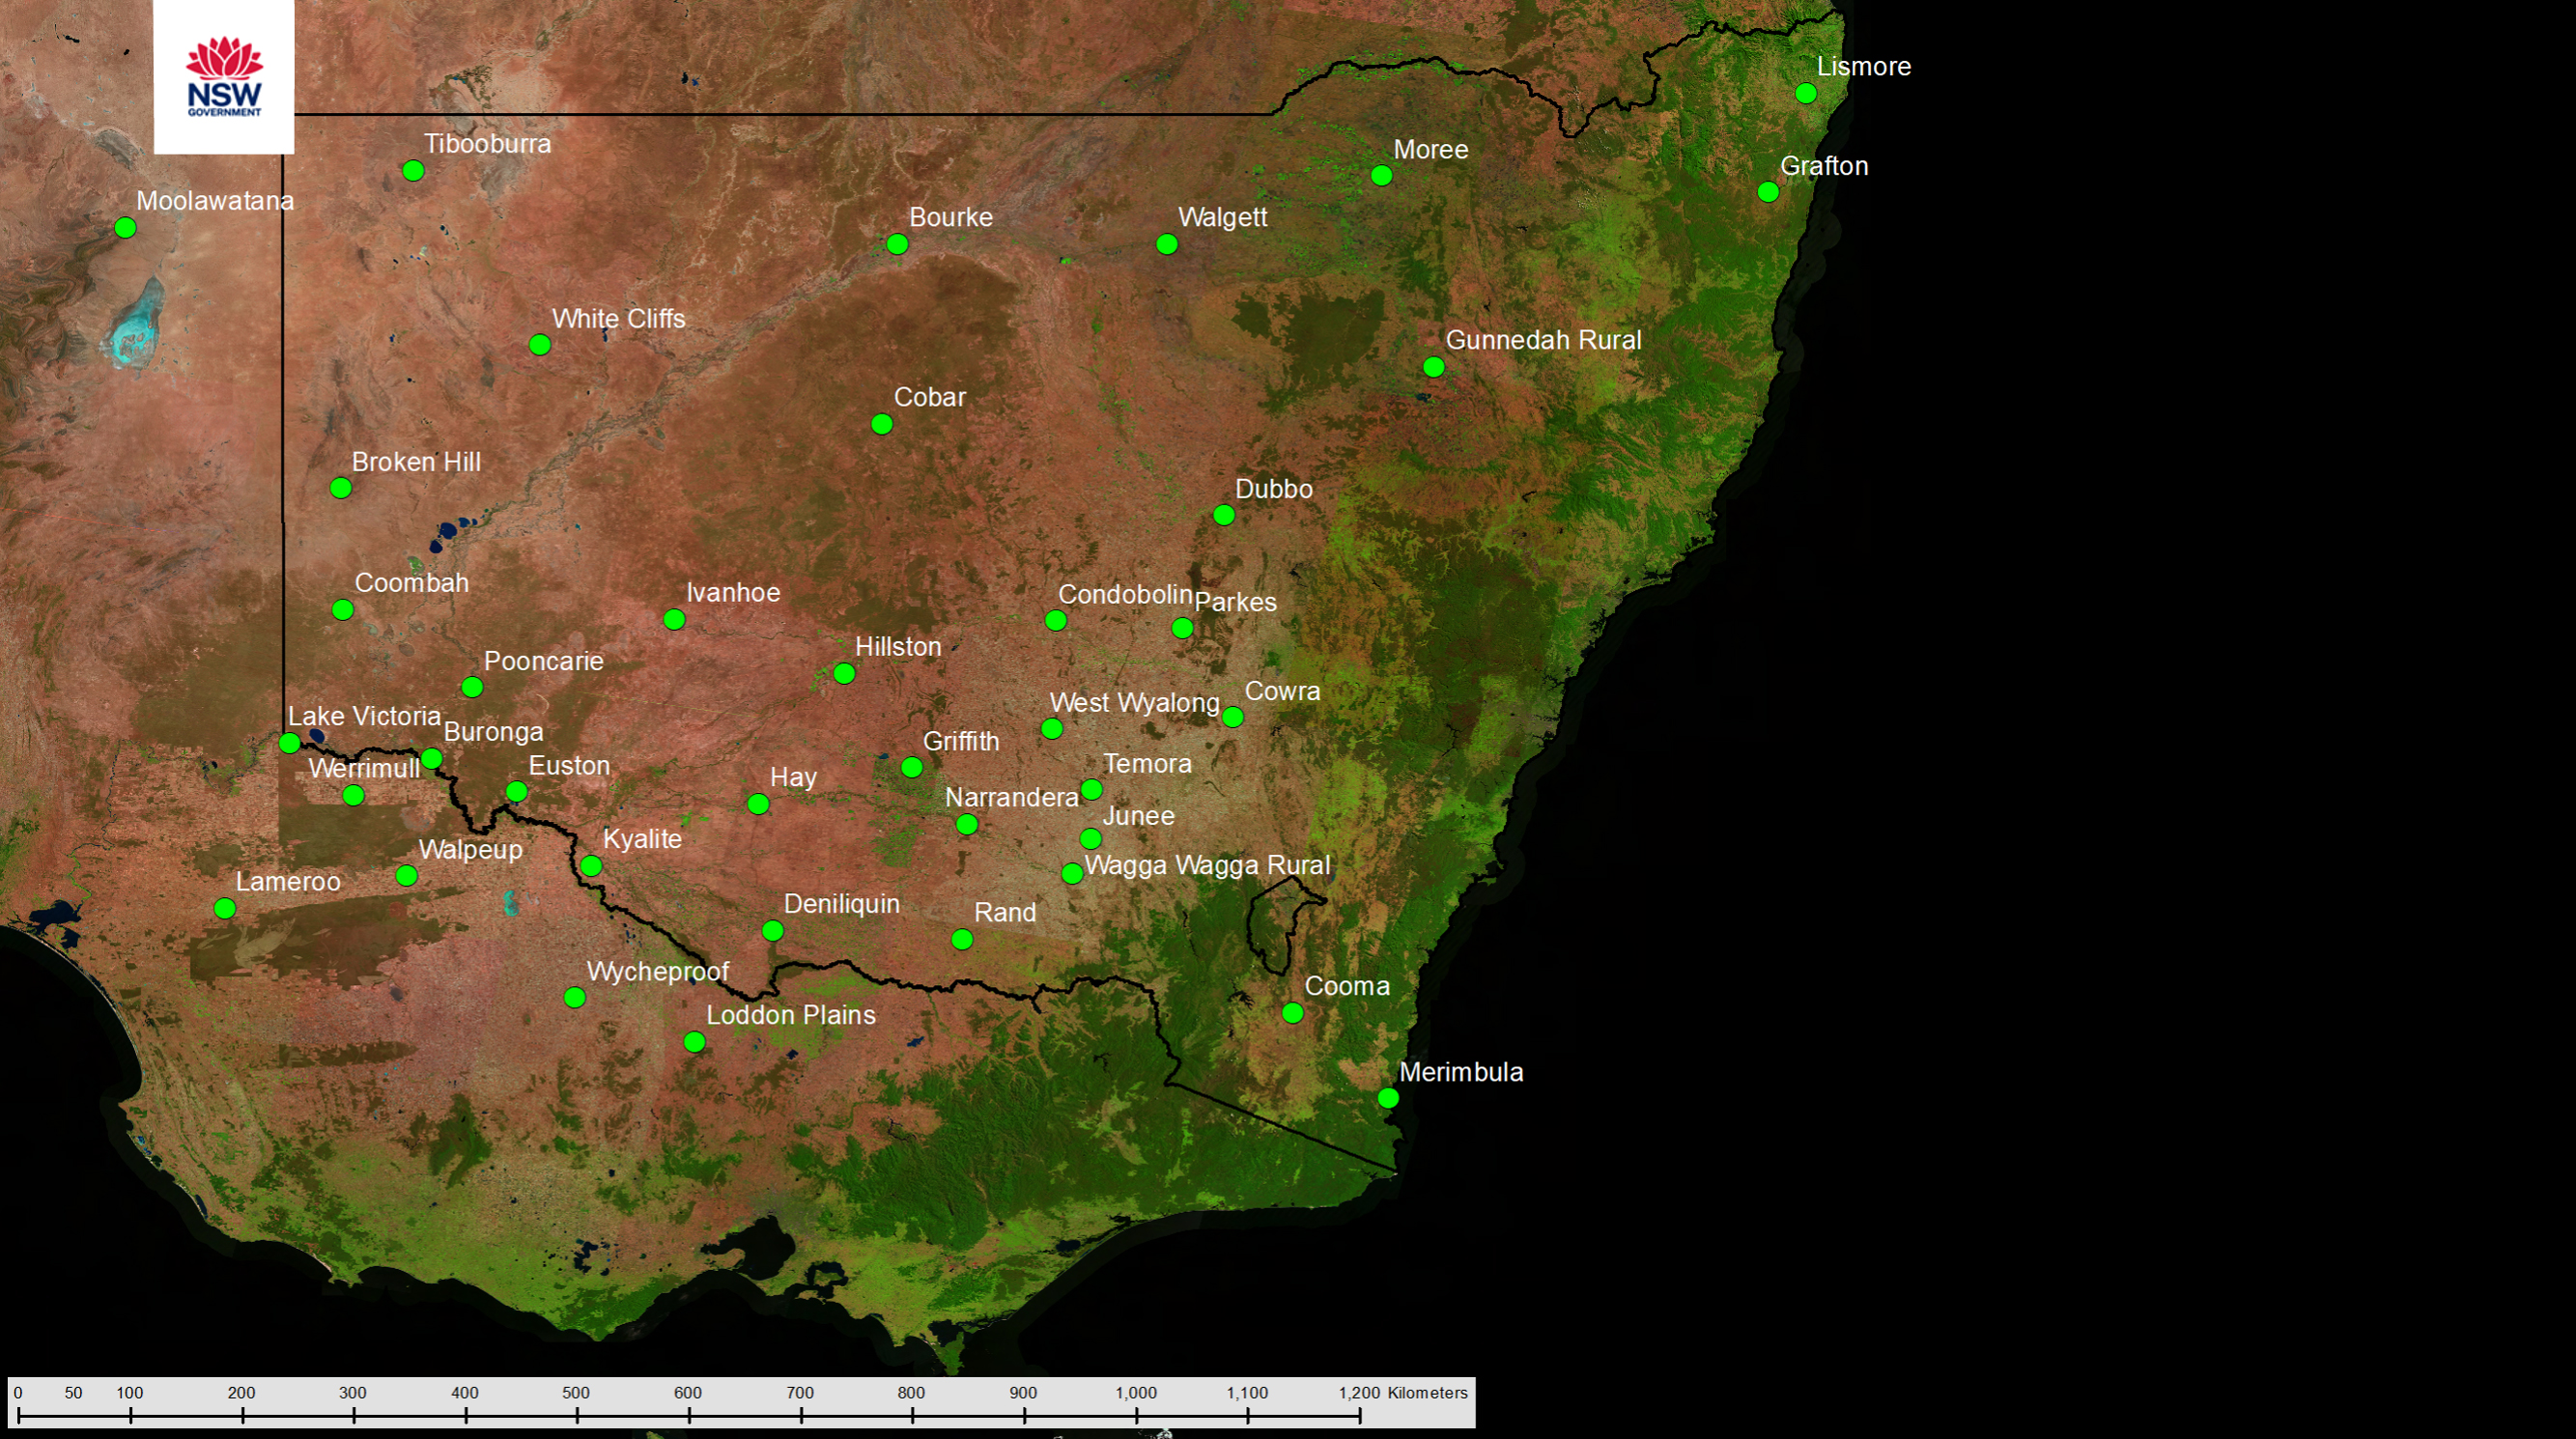
To track dust in New South Wales, we measure particles through a network of monitoring sites located in the state's rural areas. See the New South Wales Rural Air Quality Network map. This volunteer-run network includes 34 rural air quality monitoring stations in New South Wales, 2 in South Australia and 4 in Victoria. These are areas that directly impact air quality across the state.
Dust storms are measured as hours of dust exceeding thresholds for visibility set by the Bureau of Meteorology and corresponding particle concentrations measured by the network's particle monitors. Dust hours are separated from those due to smoke and fog, using a manual classification process.
More information on the Rural Air Quality Network, including monthly newsletters and air quality monitoring reports can be found on our DustWatch pages.
Dust trends in 2023
- January to March 2023 was wetter-than-average, which led to much higher-than-expected groundcover in western New South Wales and adjacent states. Areas below 50% groundcover were restricted to the state's north-west, west of the Darling River corridor, but with no significant dust emissions from those areas either.
- April to June 2023 was dominated by higher-than-average rainfall in the state's west but much lower-than-average rainfall in the north and east. This led to much welcome autumn growth in the west and the onset of very dry conditions in the east. Wind strengths were on par with averages for this time of year (see Hours of strong winds in 2023 graph). Dust emissions, predominantly from the west of the state, were still very low.
- July to September 2023 was characterised by extremely dry conditions across New South Wales and the onset of severe drought conditions across the state's north-east and south-east. Dust emissions increased slightly in those areas but remained low due to very good, albeit dry, groundcover.
- October to December 2023 saw a mix of conditions. Winds increased during October 2023 (see Hours of strong winds in 2023 graph), leading to increased dust emissions. This factor significantly contributed to the higher annual totals recorded particularly in the Riverina and Western Local Land Services regions (see Dust hours in 2023 table). However, the state also experienced widespread and substantial rainfall in late November. The mild conditions that followed allowed pasture growth, thereby increasing ground cover and reducing further dust emissions.
More details are in the monthly reports for the network.
Hours of strong winds in 2023 compared to 15-year average
Note: wind strength is expressed as hours of wind above the threshold of 40 km/hr.
Dust hours in 2023 ranked for rural New South Wales monitoring sites
| Monitoring site | Region | Dust hours (annual total) |
|---|---|---|
| Parkes | Central West Local Land Services | 263 |
| Hillston | Western Local Land Services | 251 |
| Narrandera | Riverina Local Land Services | 211 |
| Cobar | Western Local Land Services | 211 |
| Wagga Wagga North | Riverina Local Land Services | 210 |
| Deniliquin | Murray Local Land Services | 195 |
| Junee | Riverina Local Land Services | 185 |
| Werrimull | Mallee Catchment Management Authority (Victoria) | 184 |
| Euston | Western Local Land Services | 184 |
| Temora | Riverina Local Land Services | 131 |
| Rand | Murray Local Land Services | 123 |
| Loddon Plains | North Central Catchment Management Authority | 102 |
Notes: Sites with total dust hours between 51-100: West Wyalong, Riverina Local Land Services (91), Coombah, Western Local Land Services (87), Condobolin, Central West Local Land Services (86), Moolawatana, South Australia Arid Lands (80), Ivanhoe, Lachlan Local Land Services (72), Cooma, South East Local Land Services (71), Tibooburra, Western Local Land Services (67), Lameroo, South Australia Murray Darling Basin (65), Grafton, North Coast Local Land Services (55), Broken Hill, Western Local Land Services (53), Griffith, Riverina Local Land Services (49).
Sites with total dust hours between 1-50: Lake Victoria, Western LLS (45), Dubbo, Central West LLS (41), Walgett, North West LLS (26), Moree, North West LLS (26), Wycheproof, North Central CMA (25), White Cliffs, Western LLS (23), Walpeup, Mallee CMA, Victoria (22), Kyalite, Murray LLS (18), Hay, Riverina LLS (11), Merimbula, South East LLS (8), Pooncarie, Western LLS (7), Lismore, North Coast LLS (6), Cowra, Central Tablelands LLS (5), Buronga, Western LLS (5), Bourke, Western LLS (5), Gunnedah, North West LLS (3).
Long term trends in New South Wales
The Quarterly groundcover and quarterly average dust hours graph shows the 2 major droughts since July 2005.
The first drought period was between 2007 and 2010, which had a slow decline in groundcover (dark blue line) and the corresponding slow increase in dust storms (blue). The most memorable of this drought is the 'red dawn' dust storm in September 2009, that engulfed Sydney in a red haze.
The second drought was between July 2018 and March 2020, with a much sharper decline in cover and the biggest incline in dust hours.
In 2023, rural New South Wales sites saw much fewer dust hours than recorded in the previous drought-affected years such as 2019 to 2020. Groundcover declined in 2023 since rain stopped in mid-March, but overall cover remained high enough to suppress any significant dust emissions.
Quarterly groundcover and quarterly average dust hours for July 2005 to December 2023
Note: Only long-term stations are used in the quarterly analysis above. 22 of the rural network stations are regarded long-term stations with records dating back to at least 2009.