Key points
During spring–summer 2019–20, gaseous air pollutants reached record levels across the NSW Air Quality Monitoring Network (the network).
- The highest one-hour average ozone (O3) level reached 17.9 pphm (above the benchmark of 10 pphm) at Rozelle and Earlwood in Sydney East in December 2019. This ranked the highest one-hour ozone level since 2001 and the third highest since enhanced air quality monitoring began in 1994.
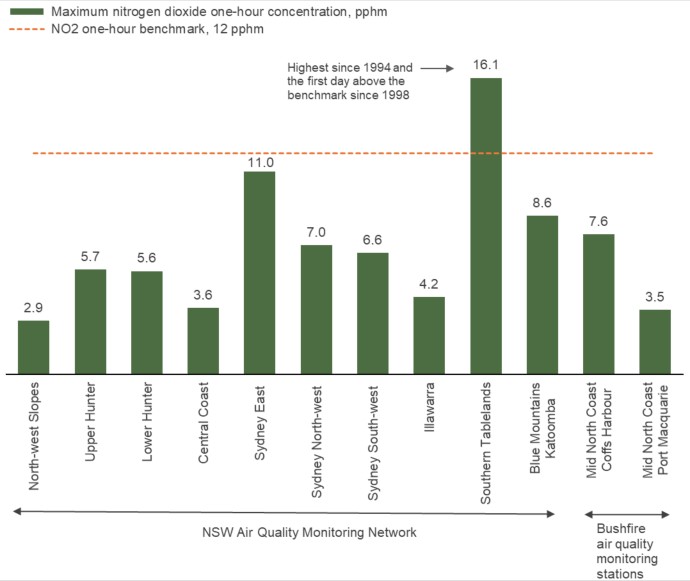
- The highest one-hour average nitrogen dioxide (NO2) level reached 16.1 pphm (above the benchmark of 12 pphm) at Goulburn in the Southern Tablelands on 31 December 2019. This was the first day above the benchmark since 1998 and ranked as the highest one-hour NO2 level since 1994.
- The highest eight-hour rolling average carbon monoxide (CO) level reached 9.6 ppm (above the benchmark of 9 ppm) at the bushfire monitoring station at Port Macquarie on 15 November 2019. This event was due to smoke from a peat fire in wetland and was the first day above the benchmark since the NSW bushfire emergency in spring 2013.
More detail
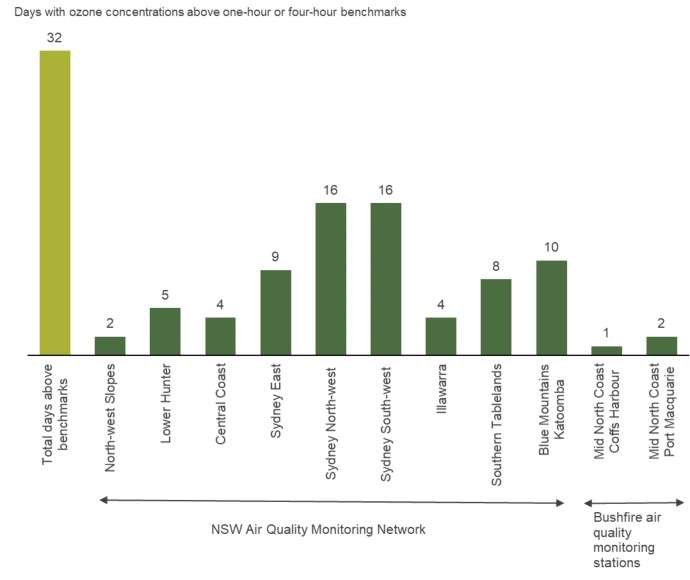
- Ozone levels across the Network were above either the one-hour or four-hour average benchmarks on 32 days, or 18% of days in spring-summer 2019-20, compared to 13 days (7% of days) in spring–summer 2018–19. The Network experienced 8 consecutive days above ozone benchmarks from 26 December 2019 to 2 January 2020.
- The number of days above ozone benchmarks across regions ranged from 2 days in the North-west Slopes to 16 days in Sydney North-west and Sydney South-west. Maximum 1-hour and 4-hour ozone levels were up to 1.8 and 1.9 times the benchmark, respectively. Sydney East recorded the third highest one-hour ozone level since 1994, with 17.9 pphm recorded at Earlwood on 10 December and at Rozelle on 19 December 2019. Rozelle recorded the third highest four-hour ozone level since 1994, with 14.9 pphm on 19 December 2019.
- Nitrogen dioxide was above the benchmark on 1 day across the network. Goulburn in the Southern Tablelands recorded the highest hourly NO2 level (16.1 pphm, 1.3 times the benchmark) since 1994, at 7 pm on 31 December 2019. At the same hour, Goulburn recorded the highest nephelometer reading (visibility reduction) since 1994. A southerly change brought thick smoke to the region from the Currowan and Palerang fires to the south and east. Before spring–summer 2019–20, the previous NO2 record was 13.3 pphm at Bringelly in Sydney South-west on 15 January 1996.
- The 8-hour rolling average CO levels were above the benchmark on 2 days (9.6 and 9.3 ppm on 11 and 15 November, respectively) at the Port Macquarie bushfire monitoring station. Before spring–summer 2019–20, the previous record for a non-roadside station was 9.1 ppm at Campbelltown West in Sydney South-west on 21 October 2013, during the NSW bushfire emergency in 2013.
- Sulfur dioxide levels were below benchmarks across the network, with the highest SO2 level (13.0 pphm) recorded at Muswellbrook in the Upper Hunter on 15 October 2019. This record ranked as the highest since 2016.
Ozone (O3)
The national standard for ozone is:
- one-hour average – 10 parts per hundred million (10 pphm), national standard
- four-hour average – 8 parts per hundred million (8 pphm), national standard.
Ozone levels were over the one-hour and/or four-hourly benchmarks on 32 days, or 18% of spring-summer days:
- ranging from 9 to 16 days across the Sydney regions (Sydney East, Sydney North-west, Sydney South-west)
- 10 days in the Blue Mountains (at Katoomba)
- 8 days in the Southern Tablelands (at Goulburn)
- 4 and 5 days in the Illawarra, Central Coast and Lower Hunter
- 2 days at Gunnedah in the North-west Slopes
- 2 days at Port Macquarie
- 1 day at Coffs Harbour
Note: Coffs Harbour may have experienced ozone levels above the benchmarks before monitoring began on 22 November 2019.
Standard monitoring network by region one-hour levels
The maximum one-hour ozone levels were:
- 11.1 to 17.9 pphm, 1.1 to 1.8 times the benchmark, in the Illawarra and Sydney regions
- 14.7 pphm, 1.5 times the benchmark, in the Southern Tablelands
- 10.1 to 12.6 pphm, 1.01 to 1.3 times the benchmark, in the Central Coast and Lower Hunter
- 11.6 pphm, 1.2 times the benchmark in the Blue Mountains (at Katoomba)
- 9.4 pphm, below the benchmark, in the North-west Slopes
Bushfire air quality monitoring stations on Mid-North Coast one-hour levels
The maximum one-hour ozone levels were:
- 10.2 pphm, 1.02 times the benchmark at Coffs Harbour
- 9.4 pphm, below the benchmark at Port Macquarie
Standard monitoring network by region four-hour levels
The maximum four-hour ozone levels were:
- 9.4 to 14.9 pphm, 1.2 to 1.9 times the Illawarra and Sydney regions
- 13.7 pphm, 1.7 times the in the Southern Tablelands
- 10.9 pphm, 1.4 times the benchmark in the Blue Mountains (at Katoomba)
- 9.0 to 10.7 pphm, 1.2 to 1.3 times the benchmark in the Central Coast and Lower Hunter
Bushfire air quality monitoring stations on the Mid-North Coast four-hour levels
The maximum four-hour ozone levels were:
- 9.8 pphm, 1.2 times the benchmark at Coffs Harbour
- 9.0 pphm, 1.1 times the benchmark at Port Macquarie
- Highest, 2001: 18.2 pphm at Parramatta North in Sydney North-west on 30 December 2001 at 11am
- Second highest, 2003: 18.1 pphm at Blacktown in Sydney North-west on 21 January 2003 at 2pm
- Third equal highest, 2019: 17.9 pphm at Earlwood in Sydney East on 10 December 2019 at 12pm and at Rozelle in Sydney East on 19 December 2019 at 12pm
- Fourth highest, 2019: 17.6 pphm at Chullora in Sydney East on 10 December 2019 at 12pm
- Fifth highest, 2001: 17.5 pphm at Bringelly in Sydney South-west on 23 January 2001 at 3pm
- Sixth highest, 1997: 17.4 pphm at Randwick in Sydney East on 17 December 1997 at 2pm
- Highest, 2003: 15.7 pphm at Blacktown in Sydney North-west on 21 January 2003 at 3pm
- Second highest, 1997: 15.3 pphm at Randwick in Sydney East on 17 December 1997 at 4 pm
- Third highest, 2019: 14.9 pphm at Rozelle in Sydney East on 19 December 2019 at 1pm
- Fourth highest, 2001: 14.0 pphm at Parramatta in Sydney North-west on 30 December 2001 at 12pm
- Fifth highest, 2003: 13.8 pphm at Richmond in Sydney North-west on 21 January 2003 at 5pm
Nitrogen dioxide (NO2)
The national standard for nitrogen dioxide are:
- one-hour average – 12 parts per hundred million (12 pphm), national standard.
Days above the benchmark:
- 1 day above the benchmark in the Southern Tablelands (measured at Goulburn)
Standard monitoring network by region one-hour levels
The maximum one-hour nitrogen dioxide levels were:
- 16.1 pphm, 1.3 times the benchmark in the Southern Tablelands, highest since 1994 and the first day above the benchmark since 1996.
- 4.2 to 11.0 pphm, below the benchmark across the Illawarra and Sydney regions
- 8.6 pphm, below the benchmark in the Blue Mountains (at Katoomba)
- 3.6 to 5.7 pphm, below the benchmark in the Central Coast and Upper Hunter and Lower Hunter
- 2.9 pphm, below the benchmark in the North-west Slopes
Bushfire air quality monitoring stations on the Mid-North Coast one-hour levels
The maximum one-hour nitrogen dioxide levels were:
- 7.6 pphm, below the benchmark at Coffs Harbour
- 3.5 pphm, below the benchmark at Port Macquarie
- Highest, 2019: 16.1 pphm at Goulburn in the Southern Tablelands on 31 December 2019 at 7pm
- Second highest, 1996: 13.3 pphm at Bringelly in Sydney South-west on 15 January 1996 at 6pm
- Third highest, 1998: 12.6 pphm at Lidcombe in Sydney East on 26 February 1998 at 10am
- Fourth highest, 2019: 11.9 pphm at Goulburn in the Southern Tablelands on 21 December 2019 at 6pm
- Fifth highest, 1997: 11.3 pphm at Parramatta North in Sydney North-west on 18 December 1997 at 9am
- Sixth highest, 2019: 11.0 pphm at the Cook and Phillip station in Sydney East on 19 December 2019 at 12pm
Carbon monoxide
- 2 days above the benchmark at Port Macquarie on the Mid-North Coast
Standard monitoring network by region – eight-hour averages
Maximum eight-hour rolling average carbon monoxide levels:
- 8.1 ppm, below the benchmark in the Blue Mountains (at Katoomba)
- 2.9 to 3.6 ppm, below the benchmark across the Illawarra and Sydney regions
- 2.4 to 2.6 ppm, below the benchmark across the Central Coast and Lower Hunter
Bushfire air quality monitoring stations on the Mid-North Coast – eight-hour averages
Maximum eight-hour rolling average carbon monoxide levels:
- 9.6 ppm, 1.1 times the benchmark at Port Macquarie, the highest since 1994 and the first day above the benchmark since the NSW bushfire emergency in spring 2019
- 1.6 ppm, below the benchmark at Coffs Harbour
Note: Coffs Harbour may have experienced higher carbon monoxide levels before monitoring began on 22 November 2019.
- Highest, 2019: 9.6 ppm at Port Macquarie on the Mid-North Coast on 15 November 2019 at 12pm, due to smoke from a peat fire in a wetland
- Second highest, 2019: 9.3 ppm at Port Macquarie on 11 November 2019 at 5 am
- Third highest, 2013: 9.1 ppm at Campbelltown West in Sydney South-west on 21 October 2013 at 9am, during the NSW bushfire emergency 2013
- Fourth highest, 2019: 8.1 ppm at Katoomba in the Blue Mountains on 27 December 2019 at 8am due to bushfire smoke
- Fifth highest, 2020: 7.0 ppm at Katoomba on 5 January 2020 at 7am, due to bushfire smoke
Note: The records above exclude data from roadside monitoring
Sulphur dioxide (SO2)
The national standards for sulphur dioxide are:
- one-hour average – 20 parts per hundred million (20 pphm), national standard
- daily average – 8 parts per hundred million (8 pphm), national standard.
- There were no days above the hourly and daily (SO2) benchmarks.
Sulfur dioxide levels by region
The maximum one-hour levels were:
- 13.0 pphm, below the benchmark at Muswellbrook in the Upper Hunter, the highest since 2016
- 7.7 pphm, below the benchmark at Stockton in the Newcastle local region
- 6.8 to 6.9 ppm, below the benchmark in the Lower Hunter and Central Coast
- 2.6 pphm, below the benchmark at Katoomba in the Blue Mountains
- 2.0 to 3.4 pphm, below the benchmark across Sydney regions and the Illawarra
Bushfire air quality monitoring stations on the Mid-North Coast
The maximum one-hour sulfur dioxide levels were:
- 3.9 pphm, below the benchmark at Port Macquarie. Levels reaching 8.1 pphm were observed in late July (before spring–summer 2019–20) due to smoke from a peat fire in a dry wetland.
- Highest, 2016: 21.0 pphm at Muswellbrook in the Upper Hunter on 23 December 2016 at 8am
- Second highest, 1994: 19.2 pphm at Wollongong in the Illawarra on 19 August 1994 at 1pm
- Third highest, 2014: 19.0 pphm at Muswellbrook on 7 March 2014 at 12pm
- Fourth highest, 2014: 17.1 pphm at Muswellbrook on 10 March 2014 at 12pm
- Fifth highest, 2001: 16.2 pphm at Warrawong in the Illawarra on 20 March 2001 at 12pm
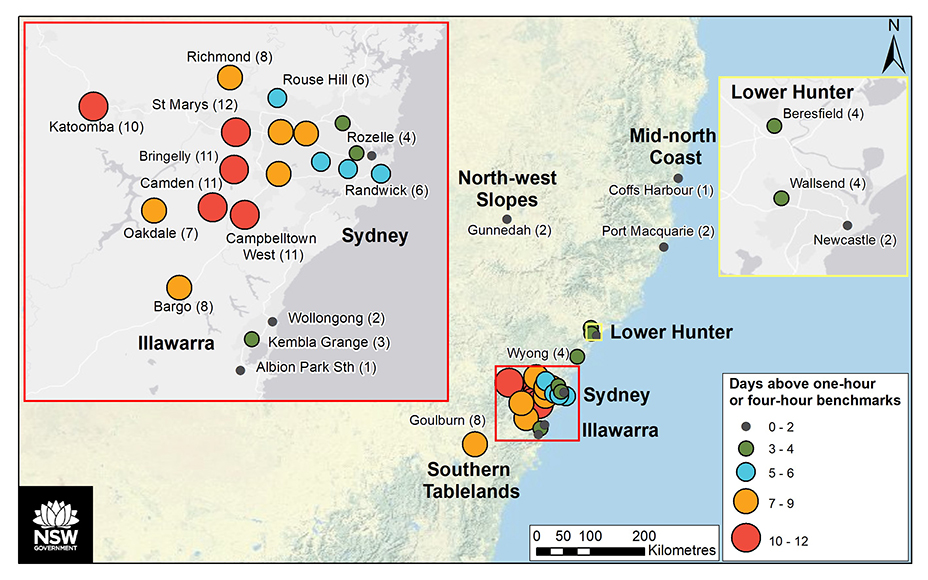
Number of days with ozone concentrations above the one-hour or four-hour benchmarks across regions in the standard monitoring network and at the bushfire air quality monitoring stations, spring–summer 2019–2020
Number of days with ozone concentrations above the one-hour or four-hour benchmark across regions in the standard monitoring network and at the bushfire air quality monitoring stations, spring–summer 2019–2020
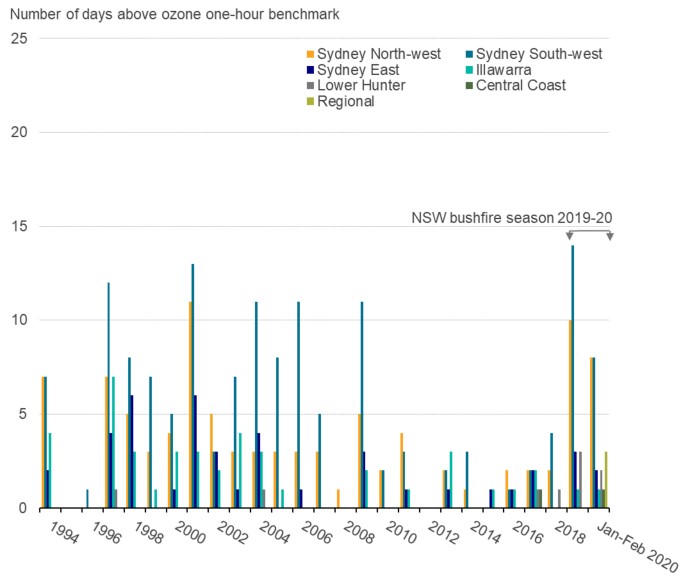
Annual number of days above the ozone one-hour benchmark by region in 1994–2019, compared to January–February 2020
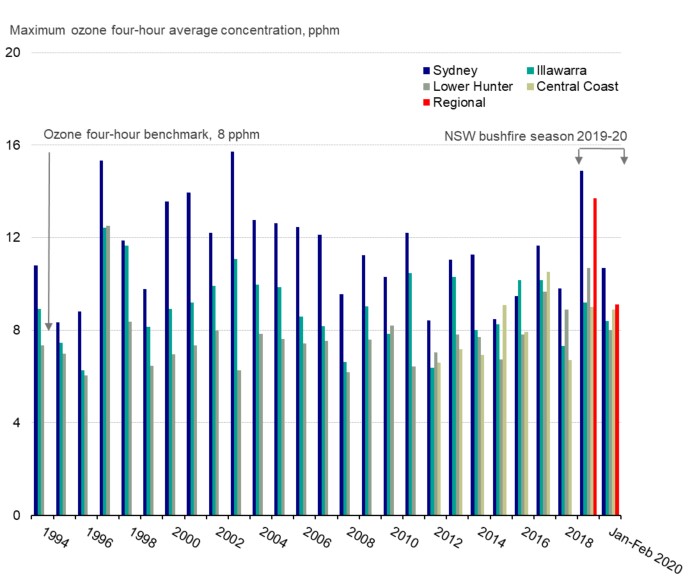
Annual maximum four-hour average ozone levels in 1994–2019, compared to January– February 2020
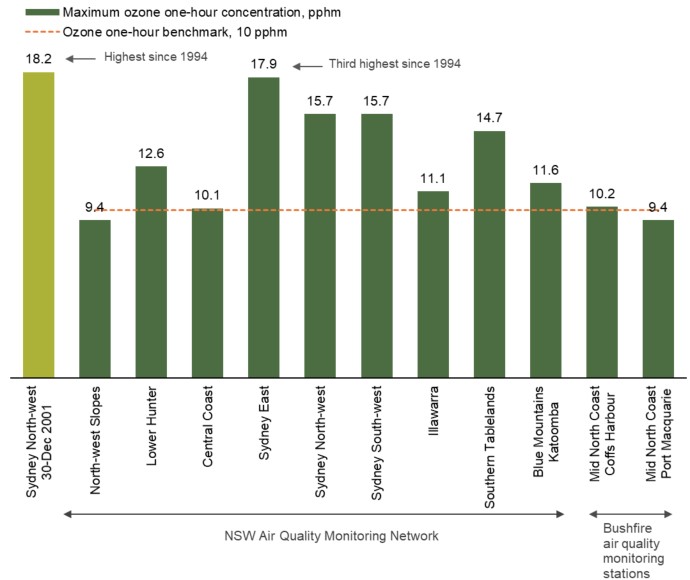
Maximum one-hour average ozone concentrations across regions in the standard monitoring network and the bushfire air quality monitoring stations, spring–summer 2019–2020

Maximum one-hour average nitrogen dioxide concentration across regions in the standard monitoring network and the bushfire air quality monitoring stations, spring–summer 2019–2020. Goulburn set the record for the highest hourly nitrogen dioxide level since 1994, on 31 December 2019 at 7pm. This was the same hour as the highest nephelometer reading for reduced visibility since 1994. A southerly change brought smoke to the region after 6pm.
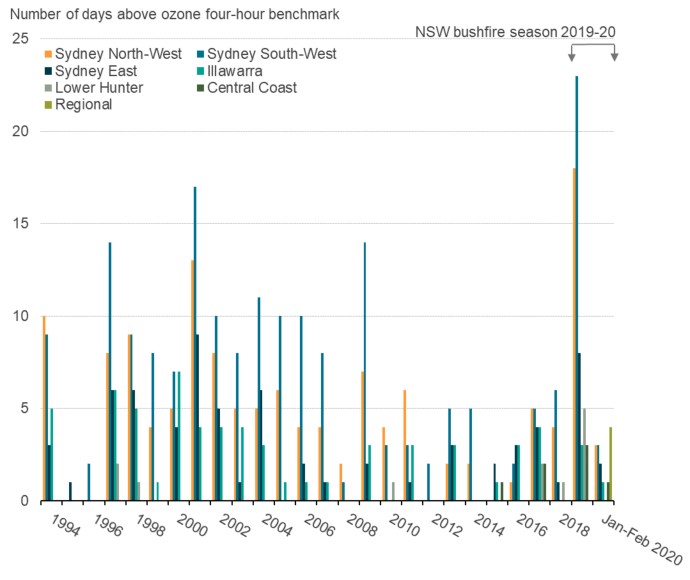
Annual number of days above the ozone one-hour benchmark by region in 1994–2019, compared to January–February 2020
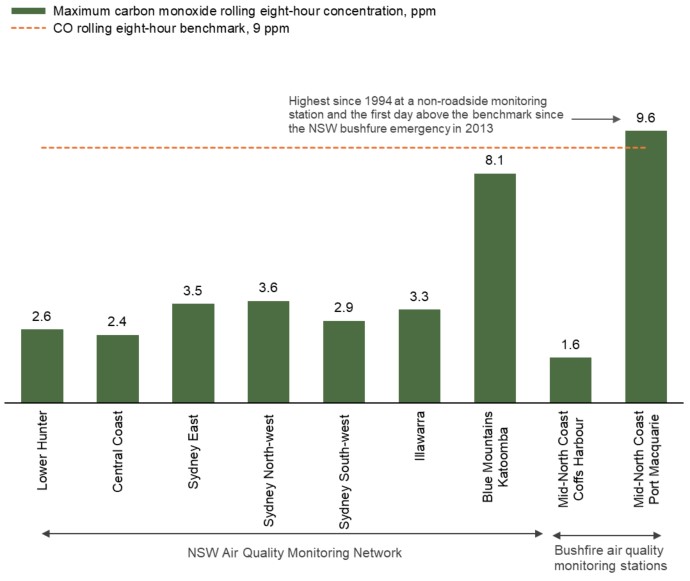
Maximum eight-hour rolling average carbon monoxide concentration across regions in the standard monitoring network and the bushfire air quality monitoring stations, spring–summer 2019–2020. Port Macquarie recorded the first day above the benchmark since the NSW bushfire emergency in 2013, due to smoke from a peat fire in a wetland.
Maximum one-hour average nitrogen dioxide concentration across regions in the standard monitoring network and the bushfire air quality monitoring stations, spring–summer 2019–2020. Goulburn set the record for the highest hourly nitrogen dioxide level since 1994, on 31 December 2019 at 7pm. This was the same hour as the highest nephelometer reading for reduced visibility since 1994. A southerly change brought smoke to the region after 6pm.
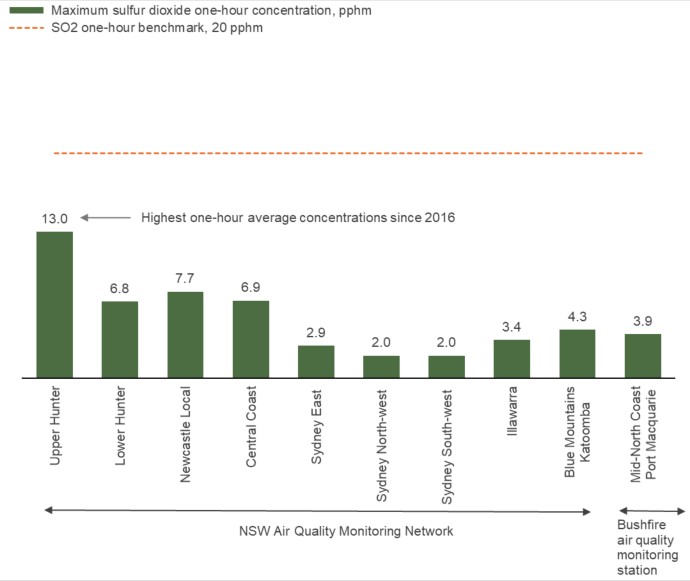
Maximum one-hour average sulfur dioxide concentration across regions in the standard monitoring network and the bushfire air quality monitoring stations, spring–summer 2019–2020