Kianga Lake is located on the south coast of New South Wales, with the township of Kianga on the southern shoreline. Kianga Lake is classed as a back-dune lagoon with an intermittently closed entrance.
Kianga Creek is the main tributary into the estuary.
Water quality report card
As part of our water quality monitoring program we assess the water quality and ecosystem health of an estuary using a range of relevant indicators. We sample a subset of the estuaries between Wollongong and the Victorian border every 3 years. The most recent sampling in Kianga Lake was completed over the 2020–21 summer when 2 sites were sampled on a monthly basis.
This report card represents 2 water quality indicators that we routinely measure: the amount of algae present and water clarity. Low levels of these 2 indicators equate with good water quality.
Algae
Water clarity
Overall grade
The report card shows the condition of the estuary was excellent with:
- algae abundance graded excellent (A)
- water clarity graded excellent (A)
- overall estuary health graded excellent (A).
Grades for algae, water clarity and overall are represented as:
- A – excellent
- B – good
- C – fair
- D – poor
- E – very poor.
Go to estuary report cards to find out what each grade means, read our sampling, data analysis and reporting protocols, and find out how we calculate these grades.
We have monitored water quality in Kianga Lake since 2011. This table shows the water quality grades for this estuary over that time.
| Year | Algae | Water clarity | Overall grade |
|---|---|---|---|
| 2011–12 | C | B | B |
| 2014–15 | C | A | B |
| 2017–18 | C | B | C |
Physical characteristics
| Estuary type | Back-dune lagoon |
|---|---|
| Latitude | –36.19 (ºS) |
| Longitude | 150.13 (ºE) |
| Catchment area | 7.5 km2 |
| Estuary area | 0.2 km2 |
| Estuary volume | 62.5 ML |
| Average depth | 0.4 m |
Notes: km2 = square kilometres; m = metres; ML = megalitres.
Water depth and survey data
Bathymetric and coastal topography data for this estuary are available in our data portal.
Land use
The catchment of Kianga Lake is moderately disturbed. Over 70% of the catchment remains forested, located on the outskirts of north Narooma. Urban land use accounts for about 15% of the catchment area, and grazing accounts for 5%.
National and marine parks
- There are no conservation areas in this catchment area.
- Kianga Lake is a sanctuary zone and is protected as part of Batemans Marine Park. This estuary flows into the marine park.
Citizen science projects
- iNaturalist’s Plants of Eurobodalla is a citizen science project that monitors plants found in the Eurobodalla region.
Community involvement
- Eurobodalla Landcare is a volunteer network of 24 Landcare groups on the New South Wales south coast.
- The Coastwatchers Association is a community environmental and conservation group based on the south coast.
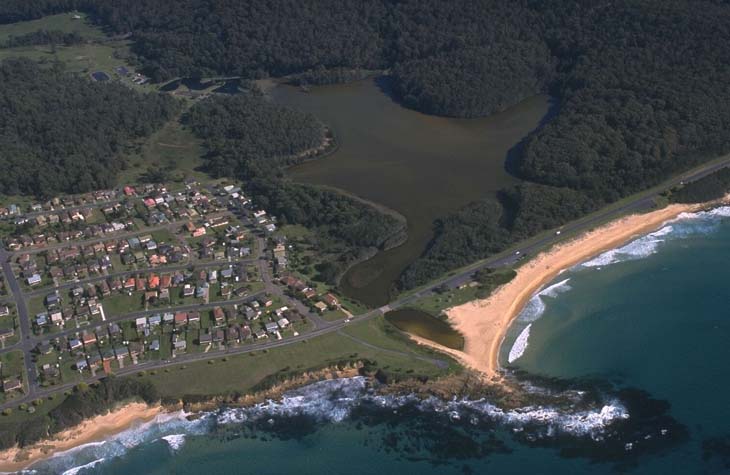
Aerial view of Kianga Lake
Local government management
Local councils manage estuaries within their area unless the estuary is attached to a marine park.
Eurobodalla Shire Council manage this estuary, which is located in Batemans Marine Park.
Threatened species
Kianga Lake is protected as part of Batemans Marine Park and contributes to the unique biodiversity found in the park.
Learn more about the biodiversity in our estuaries.