Between 2012 and 2021, WildCount used motion-sensitive digital cameras at 204 sites across 146 parks and reserves in eastern New South Wales to track changes in wildlife.
WildCount was established in response to a State of the Catchments 2010: native fauna report, which identified data gaps for a range of vertebrate species in New South Wales. The report found that we did not have enough information to assess broadscale trends in even our most common species.
WildCount was designed to improve our understanding of animals on reserves by collecting data and promoting long-term monitoring of native animal trends. The program's goals were:
- detect and report changes in species distribution using annual data
- link local observations to site characteristics and model these with occupancy trends.
The data gathered helps us manage animals on reserves better and detect changes in species due to environmental impacts like severe weather and bushfires. The videos below provide more information about the program.
WildCount provides a statewide framework for vertebrate fauna monitoring in the reserve system.
Watch our 2014 update, after 3 seasons of WildCount.
Where WildCount monitored wildlife
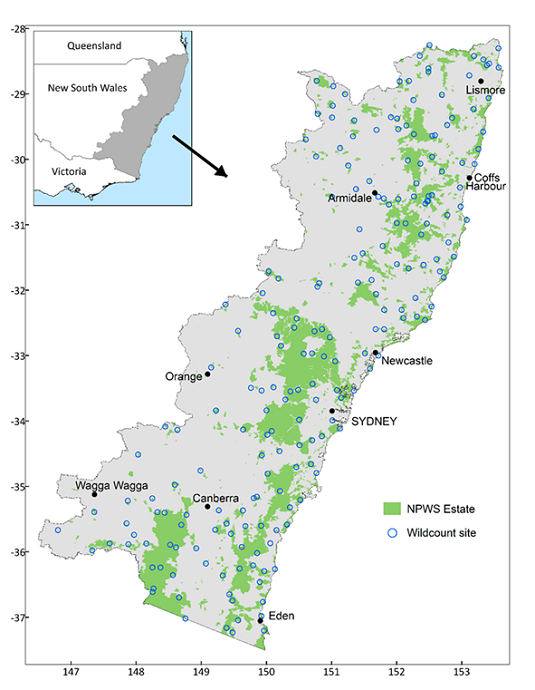
The 204 WildCount camera sites were located in 146 national parks and reserves across eastern New South Wales. Every year, 4 motion-sensing cameras were placed at each site between February and June. Cameras were left in the field for at least 2 weeks and captured over 250,000 images each year.

Figure 1: Map showing the location of 204 WildCount sites across 146 national parks and reserves in eastern New South Wales
What did we do with all the photos?
A small team of researchers processed and reviewed every image, identifying the species captured at each WildCount site. Species lists were distributed to local staff annually.
Occupancy is a measure of the proportion of sites where each species was recorded. Ecologists analysed the data to determine species occupancy over time.
The results from the first 5 years of WildCount (2012 to 2016) were published in a mid-term report, while the final 10-year report is expected to be published mid-2025.
Citizen science in action
From 2014 to 2020, WildCount was reliant on the dedication and support of volunteers. Each of the 6 field teams was made up of one National Parks and Wildlife Service officer and a volunteer operating across New South Wales from February to late May. Volunteers typically dedicated one full week to the program.
Meet volunteer Vicky as she recounts her experiences during the 2018 WildCount season.
NPWS volunteer Vicky Calleja recounts her experiences during a week of camera deployment and collection during the 2018 WildCount season.
Table 2: Contribution of volunteers to WildCount
| Year | Number of volunteers | Total volunteer hours |
|---|---|---|
| 2014 | 35 | 1,465 |
| 2015 | 58 | 1,972 |
| 2016 | 55 | 2,230 |
| 2017 | 52 | 1,945 |
| 2018 | 46 | 1,755 |
| 2019 | 43 | 1,324 |
| 2020* | 22 | 518 |
*Prior to a COVID-19 enforced shut-down
How to volunteer
If you are interested in volunteering with the National Parks and Wildlife Service, a wealth of amazing opportunities are available on the Volunteer Portal.
Photo albums
Over 1.9 million animal images have been captured as part of the WildCount program. A selection of these are available on Flickr.